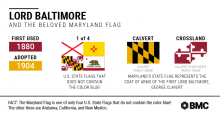
You’d be hard-pressed to go anywhere in Maryland without seeing proud residents sporting the arms of the Calvert and Crossland families, which are emblazoned on the state flag, and apparel ranging from sunglasses to socks. Maybe the flag’s popularity is because of its bright colors, busy design, or simply brilliant marketing by the state’s Tourism Board. But we’d like to think that the flag’s popularity has to do with its post-Civil War rebranding, which was intended to reconcile, quite literally, warring neighbors. Either way, its colors and patterns are rooted in the inception of Maryland’s colonial charter, which marks its 386th anniversary on Wednesday, June 20. For the occasion, we dug into our archives to present a brief history of the western world’s founding of the colony of Maryland and it’s appeal to His Royal Highness Charles I, King of England. Hint: The appeal is expansion and trade. Before European subjugation, there is evidence of inhabitants in the area dating back to the ice age. Captain John Smith - yes, the John Smith from the Disney movie - explored the upper Chesapeake in the early 1600s, and encountered many indigenous American Indians. Algonquin tribes claimed most of the land, although both Iroquois and Sioux also maintained a presence. As a result of his exploration, Smith couldn’t help but go on and on about how in awe he was over the beauty of the upper Chesapeake. We’ve hiked along the Patapsco River on a nice fall day, so we totally get the appeal, John. In fact, that’s the reason that William Claiborne, the pioneer and surveyor, first traveled to Virginia and then established a trading post on Kent Island in what’s now Queen Anne’s County. Once trade was established, the nobility and legality followed. George Calvert, the first Lord of Baltimore, explored the Potomac River and Chesapeake Bay, following stints in Newfoundland and Virginia. Calvert originally asked the king for permission to colonize the land south of Virginia, but was met with objections from its people. The king ultimately granted Calvert the land north of Virginia, but he died during the preparation of Maryland’s charter. So the land went to his heir, Cecil Calvert, the second Lord Baltimore. Once the charter’s ink was dry, King Charles I, named the new colony after his wife Queen Henrietta Marie using the name “Terra Mariae,” which means Mary Land. On November 22, 1633, Cecil Calvert set sail for this new colony in two ships - the Ark and the Dove. The ships arrived at the mouth of the Chesapeake at Old Point Comfort three months later, and sailed north to St. Clements Island before negotiating and purchasing land that they named St. Mary’s. At the end of May 1934, the Ark returned to England, leaving the Dove behind to provide transportation for goods – ranging from corn to cod - to be traded up and down the Atlantic seacoast. In August 1635, the Dove sailed back to England with furs and timber to trade, but was never seen again. The Calvert heritage can be seen on both the state seal and state flag. The Calvert colors of gold and black appear opposite the red and white colors of the Crossland family that was the family of the mother of George Calvert. So the next time that you see Maryland’s flag on tank tops or swim trunks, you’ll understand their long history. Sources: Maryland: The Seventh State, A History (Third Edition) – Author: John T. Marck – Creative Impressions, Ltd. 1995 Exploring Maryland’s Roots - http://mdroots.thinkport.org/library/kingqueen.asp Historic St. Mary’s City - https://hsmcdigshistory.org/research/maritime-curation/ark-and-dove/ Maryland Manual Online - https://msa.maryland.gov/msa/mdmanual/01glance/html/symbols/seal.html Maryland Manual Online - https://msa.maryland.gov/msa/mdmanual/01glance/html/symbols/flag.html
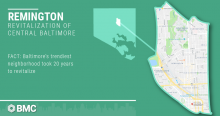
Twenty years ago, Remington faced more than a decade of population decline (8.97 percent), 2.52 percent higher than Baltimore City at the time, which the region’s stakeholders assessed negatively affected the neighborhood’s stability. On Saturday, May 12, hundreds of people milled about through a two-block area - between the newly developed and trendy mixed spaces of Remington Row and R. House - to eat, drink and listen to live music on a hot spring day. It wasn’t an event exclusively for Johns Hopkins University students, nor a give-away at Charm City Cakes. RemFest 2018, Remington’s inaugural outdoor festival, was the announcement that this is a neighborhood on the rise.On Saturday, May 12, hundreds of people milled about through a two-block area - between the newly developed and trendy mixed spaces of Remington Row and R. House - to eat, drink and listen to live music on a hot spring day. It wasn’t an event exclusively for Johns Hopkins University students, nor a give-away at Charm City Cakes. RemFest 2018, Remington’s inaugural outdoor festival, was the announcement that this is a neighborhood on the rise. But Remington’s revitalization story is a success because of its various public-private partnerships throughout the last 20 years. Residents, businesses, universities, nonprofits and the state have worked together to provide grant funding and mutually beneficial business deals to bolster these efforts and serve as a model for the Baltimore region. We dug into the Regional Information Center’s archives to read Remington’s 1998 Community Mini-Profile, one of a series that highlighted statistics in specific areas of Baltimore City, to compare it to the neighborhood’s recent renaissance. The report, prepared by the Community Development Resource Center at the Institute for Urban Research at Morgan State University, examines seven key aspects of the Remington community: population, households and families, housing, health, education, income and public assistance, and crime. The intent of the report was to assess the needs of the Remington community, but also to use it as a marketing tool to assist in the revitalization of blighted parts of the neighborhood. So let’s rewind.The demographic breakdown of Remington in 1998 was 81 percent white and 13 percent black, with 25.37 percent of residents less than 19 years old, and 22.39 percent seniors. The teen pregnancy rate (10.20 percent) was 2 percent higher than Baltimore City’s, and cancer and heart attack/stroke were the main causes of death at 35 and 31.67 percent, respectively.These demographics suggested the need for day care services, education and recreation programming, as well as medical services and alternative living arrangements. It’s encouraging to see some of these assets realized, specifically through the 2017 completion of Remington Row, one of several Central Baltimore projects by Seawall Development, includes both physicians’ offices (for children, women’s health and internal medicine), a drug store and more than 100 affordable apartments. Speaking of housing, the Remington of 1998 included 1,199 units, with 91.49 percent total occupancy and 55.52 percent owner-occupied properties, according to the report.In 1997, the Johns Hopkins University’s Live Near Your Work employer-assisted home-buying program partnered with the state to offer cash grants between $2,500 and $17,000, according to Baltimore City’s 2012 Maryland Sustainable Communities application. The intent was to help employees buy homes in targeted areas around JHU’s Homewood and medical campuses, which many have done since then, therefore increasing owner-occupancy in the neighborhood and providing it with greater stability.Finally, Remington’s 1998 household income was $22,981, with utilization of public assistance services 26 percent below Baltimore City’s at the time. Today, organizations such as the Central Baltimore Partnership, Remington Neighborhood Alliance, Greater Remington Improvement Association, Charles Village Community Benefits District, Historic Fawcett Community Association and Healthy Neighborhoods work together to advocate on behalf of the community, organize and plan, then apply for grants to improve workforce development and transportation access for residents.Twenty years ago, Remington, a neighborhood of row houses and old factories, was on the decline. But the community has come together to create a place where people want to live, work, shop and raise families.Remington is both an example of the type of transformative revitalization that can be replicated across Baltimore as well as a reminder that real community change takes time, planning and partnership. Sources:Community Mini-Profile Series 1998 No. 02 (Spring Edition): Remington, prepared by the Community Development Resource Center, Institute for Urban Research, Morgan State University, Spring 1998

You weekend warriors are in good company if – now that spring finally has sprung - you find yourself grabbing a basket full of food, soft blanket and Frisbee to head to your local park. April 23, is National Picnic Day, after all. In the Baltimore region, Carroll County is – and has been - the spot for some quality picnicking. The county planned it that way back in the late 1980s. The 1987 Carroll County Parks and Land Preservation Plan, which we found in the Regional Information Center, shows that 45 percent of survey respondents reported picnicking an average of 4.5 times a year. As a result, the plan also predicted that interest in picnicking would hold steady throughout the 1990s and into the Millennium. Carroll County’s parks and recreation areas, with 810 existing facilities, had more than enough space to accommodate the needs of the pastorally-inclined, according to the plan. Park-goers could enjoy most of that space without intrusion by other parties, too. By 1995, the plan anticipated that only 535 of its facilities would be occupied by multiple parties at a time. However, picnics hardly were the only outdoor activities that drew people to Carroll County’s facilities. Off-road vehicles - such as ATVs, dirt bikes, and modified trucks and jeeps - were on the rise in popularity, as well as organized sports. In short, they needed acres of more space. By 1987, Carroll County had limited space for off-roading, and according to their models, it would need 70.5 miles of track by 1995. Plus, the county anticipated that it should construct 46 more baseball fields, 4.5 acres of swimming pools, and 67 more basketball courts. Carroll County’s facilities currently boast more than 30 parks, and thousands of acres of open land, many of which have been added since the 1987 plan. These facilities include picnic areas, trails, hunting and fishing space, playgrounds, tennis and basketball courts, and baseball, softball and multipurpose fields.
Source: Greenhorne and O’Mara, Inc. 1987. Carroll County Parks and Land Preservation Plan, 1986-1987.
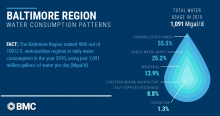
Since the 1970s and 1980s, Public Service Announcements have taught good GenXers and Millennial children about water conservation. These 60-second segments stressed that we, too, could save the planet if we kept our showers short, turned off the faucet when brushing our teeth, and washed the dinner dishes by hand. It turns out that while limiting personal consumption is beneficial, it pales in comparison to steam-generated thermoelectric power, which consumes many millions more gallons of water per day. So while April showers pour down all around us, we looked at the Brookings Institute’s February 2018 report “Exploring national and local water use patterns in the U.S.” to see how our region consumes its H2O.The Baltimore region used 1,091 million gallons of water per day (Mgal/d) in 2010, according to the Brookings Institute. The majority of that usage, 55.5 percent, went toward thermoelectric power at plants - such as the Wheelabrator Baltimore in the Westport neighborhood of Baltimore City and Herbert A. Wagner generating station in northern Anne Arundel County - while public water supply was responsible for 25.2 percent. Industrial usage accounted for 13.9 percent of the region’s water usage; 8.8 percent went to things such as livestock, mining, aquaculture and self-supplied residences; and very little, 1.3 percent, was used for irrigation. This ranked Baltimore’s usage 40th out of 100 U.S. metropolitan regions in 2010.By comparison, the U.S. as a whole used 355 billion gallons of water per day (Bgal/d) in 2010, according to Brookings. Approximately 45.3 percent of that usage went to thermoelectric power, while 32.3 percent went to irrigation, 11.8 percent to public supply, and 4.5 percent to industrial. That’s a tidal wave of water flowing to keep our electricity on and crops growing! But between 2010 and 2015, residential water use in the Baltimore region dropped by 22 million gallons per day, while population increased by nearly 87,000. So how do we explain population growth and water consumption decline? One explanation may be that our household appliances simply are becoming more efficient – from our washing machines to dishwashers - and consuming less water. Sources: Brookings Institute’s February 2018 report “Exploring national and local water use patterns in the U.S."Brookings, “Less water, more risk: Exploring national and local water use patterns in the US,” 2017.Brookings, “US households are using less water, but what does that mean for metros and infrastructure?,” 2017.

Play ball! The Orioles take on the Minnesota Twins this Thursday, March 29, for Opening Day at Camden Yards. With all the excitement of another professional baseball season, we’ve been a bit curious about Camden Yards’ history, so we dug through the Regional Information Center’s archives.The building of Camden Yards Sports Complex was a hot topic right up until they broke ground in 1988. How much money would a brand new ballpark really bring in? Could it ever replace the much-loved Memorial Stadium? Would it attract new sports talent to Baltimore? New fans? This report from 1996 looked at estimates produced by several Maryland departments including the Department of Fiscal Services, the Office of the Governor, and the Baltimore Development Corporation, and then compared them to the actual financial and political impact post-construction. Estimates predicted a 20 percent increase in attendance from the 1991 final season at Memorial Stadium, creating millions of dollars in direct and indirect benefits to the city. Instead, the 1992 Orioles season smashed expectations with a 76 percent increase. Out-of-town visitors flooded in to eat at local restaurants and stay in downtown hotels, boosting revenues from the new stadium even further. Ultimately, visitors came more often and spent more money in Baltimore City. Camden Yards was built as a baseball-only field in order to keep the Orioles franchise interested. After much debate and negotiation, a football stadium was built as part of the Camden Yards Sports Complex in order to attract a football franchise back to Baltimore. Many of the stadium’s supporters used the results of Camden Yards to show how successful the football stadium could be. The Camden Yards ballpark itself became an example of the potential success of future sports projects. The Ravens played their first two years in Baltimore at the old Memorial Stadium before moving to M&T Bank Stadium for the 1998 season. The Baltimore Sun reported in 2017 that during the 2014 and 2015 seasons, spending associated with games averaged $331.3 million and state tax revenue generated approximately $22.5 million. So however you play it, constructing Camden Yards turned out to be a home run for Baltimore!
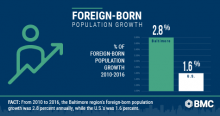
If you’re anything like us, you also found yourself glued to your television, watching the 2018 Winter Olympics in PyeongChang, South Korea. These events are a wonderful way for us to cheer on the United States, watch obscure sports (we’re talking about you, biathlon), and celebrate countries and cultures from around the world. In the opening ceremonies alone, we heard a moving rendition of John Lennon’s “Imagine” and witnessed the enthusiastic return of Tonga’s shiny flag-bearer. In this year’s games we also saw, for the first time, an historic gesture of cooperation in the North and South Korean joint women’s hockey team. The flags, pageantry and intense competition make us proud to be American and remind us of the interconnected nature of our world. So BMC’s data crunchers were a bit curious about the rich cultural fabric of our own backyard – what’s the demographic breakdown of foreign-born residents in the Baltimore region? Foreign-born residents continue to move to the Baltimore region, even 289 years after the city’s founding and 150 years after the first steamships docked in the Locust Point neighborhood to unload passengers. We took a look at the Baltimore region’s foreign born population from 1970 to 2016, which is the most recent data available. In 1970, the total foreign born population in the Baltimore region was 2.8 percent of 2.1 million residents, while Maryland’s was 3.2 percent of 3.7 million residents, and the U.S. had 4.8 percent among 193 million residents. By 2016, Baltimore’s foreign born population shot to 10.4 percent of its 2.8 million residents. Compare that to 15.3 percent of Maryland’s 6 million residents and 13.5 percent of the U.S.’s 323 million residents. While this wasn’t particularly surprising, what we found interesting is that since 1990, the Baltimore region’s foreign-born population is growing at a faster rate than both Maryland and the U.S. From 2010 to 2016, the Baltimore region’s foreign-born growth is 2.8 percent annually, while Maryland’s is 2.5 percent, and the nation as a whole is 1.6 percent. In addition, foreign-born residents are coming to the Baltimore region from vastly different countries in 2016 than they did in 1970. In 1970, 64.7 percent of foreign-born residents in the Baltimore region came from European countries, whereas only 11.1 percent came from Europe by 2010. By comparison, 9.3 percent of the region’s foreign-born residents came from Asian countries in 1970, while 38.7 percent came from Asia in 2010. For more specific information about our region’s foreign-born residents, we then dug into the U.S. Census Bureau’s American Community Survey for 2016. In 2016, 9.7 percent of the Baltimore region’s foreign-born residents were from India, followed by 6.9 percent from Korea, 5.9 percent from China, and 5 percent each from El Salvador and the Philippines. In Maryland, 12.1 percent of the foreign-born population, the highest for the state, came from El Salvador. By contrast, the largest share of the U.S.’s foreign-born population - 26.5 percent - came from Mexico. While we patiently await the 2020 Summer Olympics in Tokyo when we can again don our Team USA gear, remember there is a wealth of cultural diversity to be celebrated right here at home in greater Baltimore each and every day. Sources: IPUMS NHGIS, University of Minnesota, www.nhgis.org; U.S. Census Bureau American Community Survey 2016
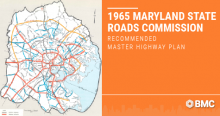
Motorists driving through the Baltimore region may notice several ramps to nowhere along I-95 as they travel into or out of Baltimore City. Once upon a time, these structures were part of a massive regional highway plan.We dug into the archives at the Regional Information Center (RIC) and found the 1965 Maryland State Roads Commission Recommended Master Highway Plan. The document was a grand proposal for I-70 - the major highway that begins in the Baltimore City neighborhood of Franklintown and runs east-west through Maryland to Breezewood, Pa. As put forth more than five decades ago, this highway would have extended to meet I-95 in Baltimore City’s central business district. Problems with traffic congestion and flow already were in full swing in the early 1960s in the Baltimore region. The plan projects growth of more than 2.6 million residents and more than 700,000 vehicles by 1980. This was a tall order for the region’s road network. So as the U.S. Department of Transportation constructed I-95 north and south through central Maryland, the Recommended Master Highway Plan was the solution. The ramps were built, but the I-70 connection never came to fruition. Nor did the construction of the proposed I-83 route through Central and South Baltimore, for that matter. I-70 was scheduled to go straight through the Baltimore City neighborhoods of Fells Point and Canton, while many of the planned higher-occupancy roadways ran through historically low-income and African-American neighborhoods. That’s why community activists, such as Barbara Mikulski, then a fresh graduate of the University of Maryland’s School of Social Work and east Baltimore native, organized city residents from east to west to stop the projects in their tracks. Source: Baltimore Metropolitan Area Transportation Study. Master Highway Plan