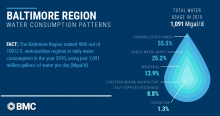
Since the 1970s and 1980s, Public Service Announcements have taught good GenXers and Millennial children about water conservation. These 60-second segments stressed that we, too, could save the planet if we kept our showers short, turned off the faucet when brushing our teeth, and washed the dinner dishes by hand. It turns out that while limiting personal consumption is beneficial, it pales in comparison to steam-generated thermoelectric power, which consumes many millions more gallons of water per day. So while April showers pour down all around us, we looked at the Brookings Institute’s February 2018 report “Exploring national and local water use patterns in the U.S.” to see how our region consumes its H2O.The Baltimore region used 1,091 million gallons of water per day (Mgal/d) in 2010, according to the Brookings Institute. The majority of that usage, 55.5 percent, went toward thermoelectric power at plants - such as the Wheelabrator Baltimore in the Westport neighborhood of Baltimore City and Herbert A. Wagner generating station in northern Anne Arundel County - while public water supply was responsible for 25.2 percent. Industrial usage accounted for 13.9 percent of the region’s water usage; 8.8 percent went to things such as livestock, mining, aquaculture and self-supplied residences; and very little, 1.3 percent, was used for irrigation. This ranked Baltimore’s usage 40th out of 100 U.S. metropolitan regions in 2010.By comparison, the U.S. as a whole used 355 billion gallons of water per day (Bgal/d) in 2010, according to Brookings. Approximately 45.3 percent of that usage went to thermoelectric power, while 32.3 percent went to irrigation, 11.8 percent to public supply, and 4.5 percent to industrial. That’s a tidal wave of water flowing to keep our electricity on and crops growing! But between 2010 and 2015, residential water use in the Baltimore region dropped by 22 million gallons per day, while population increased by nearly 87,000. So how do we explain population growth and water consumption decline? One explanation may be that our household appliances simply are becoming more efficient – from our washing machines to dishwashers - and consuming less water. Sources: Brookings Institute’s February 2018 report “Exploring national and local water use patterns in the U.S."Brookings, “Less water, more risk: Exploring national and local water use patterns in the US,” 2017.Brookings, “US households are using less water, but what does that mean for metros and infrastructure?,” 2017.