
The Baltimore Metropolitan Council collects, maintains, analyzes, and reports on data from numerous sources. Geographic analysis has become an integral part of BMC projects. BMC utilizes the newest technology in support of projects including geoprocessing, modelling, maps, online interactive applications, and dashboards. These products illustrate the range of analytic, cartographic, and other technical capabilities of our staff.
.jpg)
BMC 2024 Annual Report Story Map
Story map for Baltimore Metropolitan Council's 2024 Annual Report, including the agency's audited financial statements and an overview of the agency's work from the previous fiscal year

Investing in a Resilient Future Story Map
Story map for public outreach on Resilience 2050 long-range transportation plan (LRTP), 2024-2027 TIP and associated Air Quality Conformity Determination.
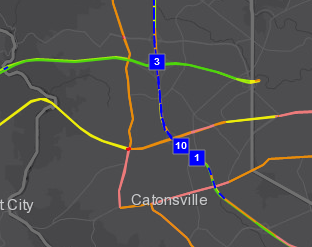
Congestion Management Process Analysis Tool
This tool allows users to study the top bottlenecks of the region along with other related data including road speeds and planned transportation products.
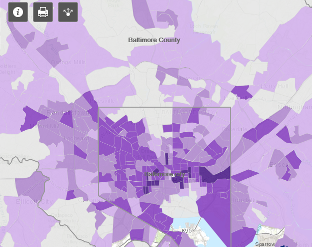
Vulnerable Population Index 2020
Map showing the 2020 Vulnerable Population Index along with the component demographic layers.
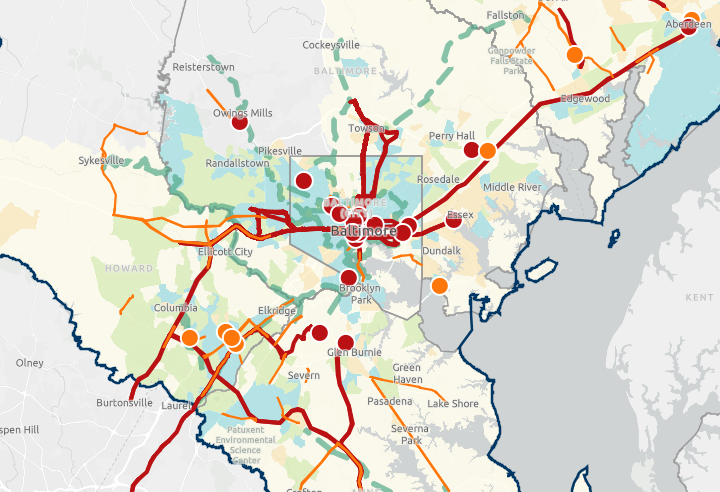
Resilience 2050 Project Viewer
Resilience 2050 preferred alternative projects along with datasets depicting various environmental resources that were used by BMC staff to score candidate projects.
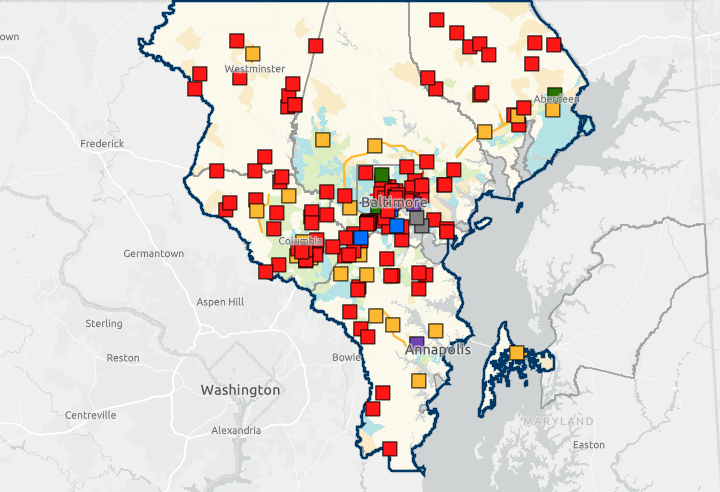
2024-2027 TIP Project Viewer
Projects in the 2024-2027 Transportation Improvement Program (TIP) projects along with an Environmental Justice by TAZ layer.
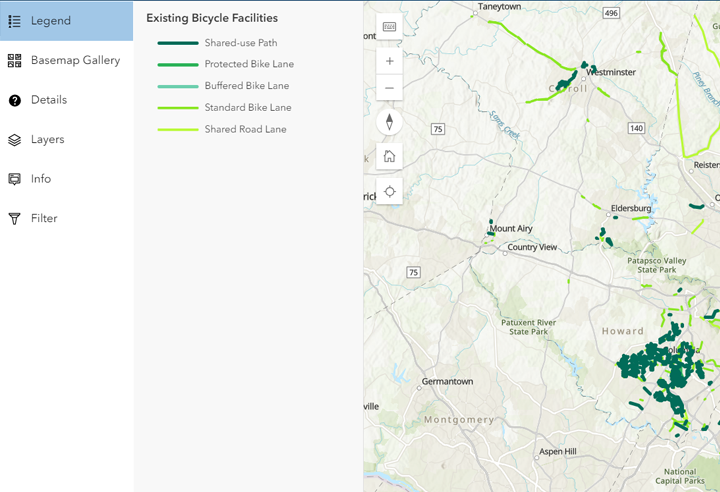
Regional Bicycle Facilities Inventory
The Regional Bicycle Facilities Inventory (RBFI) layer contains all existing bicycle trails and lanes (facilities) in the region.
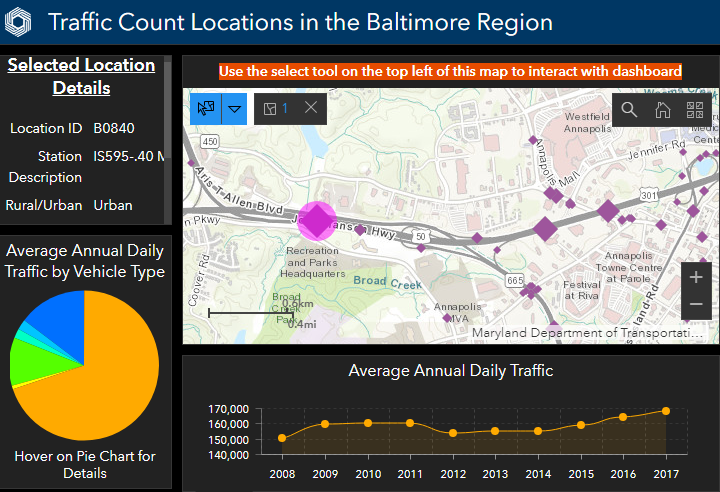
Traffic Count Dashboard
Dashboard showcasing traffic count location details with graphs by year of Average Annual Daily Traffic (AADT) and Average Annual Weekday Daily Traffic (AAWDT) counts.
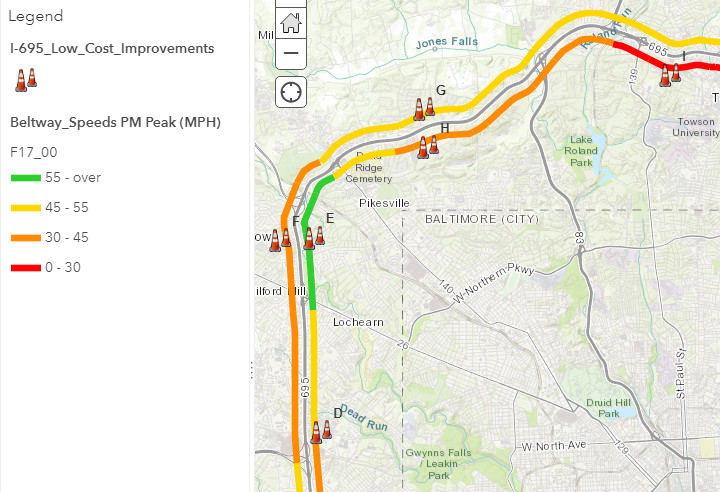
I-695 (Baltimore Beltway) Low Cost Improvements
Conceptual traffic analysis conducted by SHA to identify ways to improve operational and overall safety conditions on I-695 from I-95 (Arbutus) to MD 43 (White Marsh).
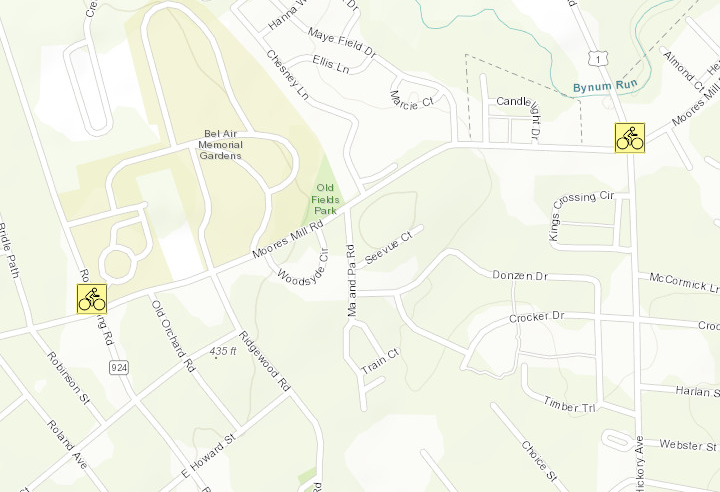
Bicycle And Pedestrian Counts 2013
Bicycle and pedestrian counts taken at 19 locations throughout the Baltimore region in Spring 2013. Counts were taken at 2 days at each location hourly from 6am to 7pm.
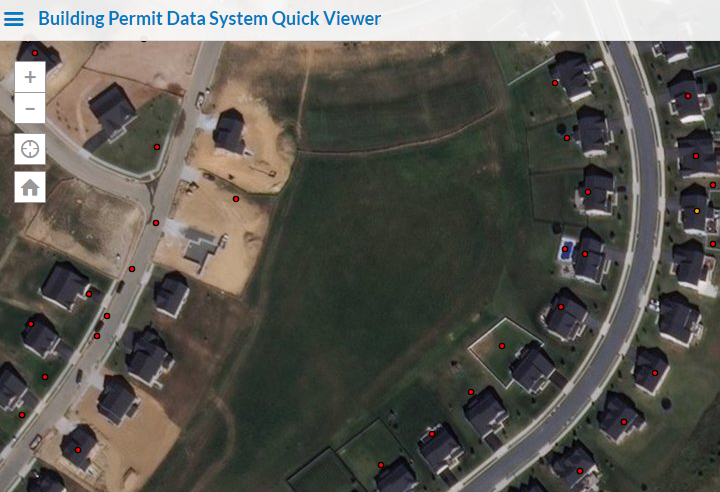
Building Permit Data System Quick Viewer
This data set shows building permits for the Baltimore metropolitan region. The data goes back to 2000 and is updated approximately once every two months.