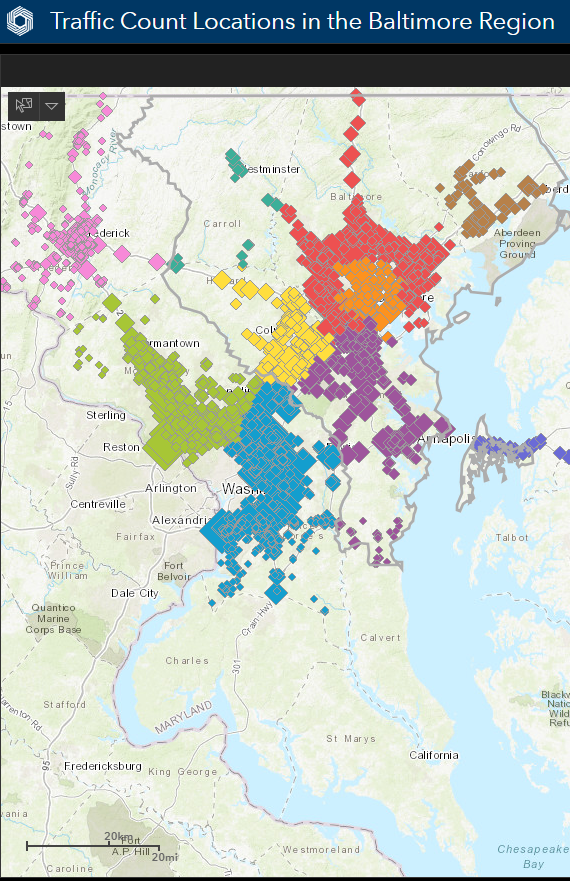
Geospatial and demographic analysis have become a key part of the transportation planning process. Examples include identifying traffic bottlenecks, illustrating bicycle and pedestrian access to train stops, and evaluating the impact highway projects have on disadvantaged communities. The Baltimore Metropolitan Council collects, maintains, analyzes, and reports on data including traffic counts, highway speeds, and public transportation routes. BMC utilizes the newest technology in support of projects including geoprocessing, modelling, maps, online interactive applications, and dashboards. These products illustrate the range of analytic, cartographic, and other technical capabilities of the Baltimore Metropolitan Council staff.

This dashboard showcases traffic count locations and traffic count location details. Average Annual Daily Traffic (AADT) and Average Annual Weekday Daily Traffic (AAWDT) counts at each location are graphed by year. Additional details are provided for each traffic count location such as Location ID, station description, road name, road functional class, road section, begin section, end section, county name and municipality name.
