2022-2025 TIP - Baltimore City
2022-2025 TIP - Baltimore City
2021-2024 TIP - Baltimore City
2021-2024 TIP - Baltimore City
2020-2023 TIP - Baltimore City
2020-2023 TIP - Baltimore City
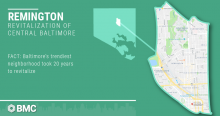
Twenty years ago, Remington faced more than a decade of population decline (8.97 percent), 2.52 percent higher than Baltimore City at the time, which the region’s stakeholders assessed negatively affected the neighborhood’s stability. On Saturday, May 12, hundreds of people milled about through a two-block area - between the newly developed and trendy mixed spaces of Remington Row and R. House - to eat, drink and listen to live music on a hot spring day. It wasn’t an event exclusively for Johns Hopkins University students, nor a give-away at Charm City Cakes. RemFest 2018, Remington’s inaugural outdoor festival, was the announcement that this is a neighborhood on the rise.On Saturday, May 12, hundreds of people milled about through a two-block area - between the newly developed and trendy mixed spaces of Remington Row and R. House - to eat, drink and listen to live music on a hot spring day. It wasn’t an event exclusively for Johns Hopkins University students, nor a give-away at Charm City Cakes. RemFest 2018, Remington’s inaugural outdoor festival, was the announcement that this is a neighborhood on the rise. But Remington’s revitalization story is a success because of its various public-private partnerships throughout the last 20 years. Residents, businesses, universities, nonprofits and the state have worked together to provide grant funding and mutually beneficial business deals to bolster these efforts and serve as a model for the Baltimore region. We dug into the Regional Information Center’s archives to read Remington’s 1998 Community Mini-Profile, one of a series that highlighted statistics in specific areas of Baltimore City, to compare it to the neighborhood’s recent renaissance. The report, prepared by the Community Development Resource Center at the Institute for Urban Research at Morgan State University, examines seven key aspects of the Remington community: population, households and families, housing, health, education, income and public assistance, and crime. The intent of the report was to assess the needs of the Remington community, but also to use it as a marketing tool to assist in the revitalization of blighted parts of the neighborhood. So let’s rewind.The demographic breakdown of Remington in 1998 was 81 percent white and 13 percent black, with 25.37 percent of residents less than 19 years old, and 22.39 percent seniors. The teen pregnancy rate (10.20 percent) was 2 percent higher than Baltimore City’s, and cancer and heart attack/stroke were the main causes of death at 35 and 31.67 percent, respectively.These demographics suggested the need for day care services, education and recreation programming, as well as medical services and alternative living arrangements. It’s encouraging to see some of these assets realized, specifically through the 2017 completion of Remington Row, one of several Central Baltimore projects by Seawall Development, includes both physicians’ offices (for children, women’s health and internal medicine), a drug store and more than 100 affordable apartments. Speaking of housing, the Remington of 1998 included 1,199 units, with 91.49 percent total occupancy and 55.52 percent owner-occupied properties, according to the report.In 1997, the Johns Hopkins University’s Live Near Your Work employer-assisted home-buying program partnered with the state to offer cash grants between $2,500 and $17,000, according to Baltimore City’s 2012 Maryland Sustainable Communities application. The intent was to help employees buy homes in targeted areas around JHU’s Homewood and medical campuses, which many have done since then, therefore increasing owner-occupancy in the neighborhood and providing it with greater stability.Finally, Remington’s 1998 household income was $22,981, with utilization of public assistance services 26 percent below Baltimore City’s at the time. Today, organizations such as the Central Baltimore Partnership, Remington Neighborhood Alliance, Greater Remington Improvement Association, Charles Village Community Benefits District, Historic Fawcett Community Association and Healthy Neighborhoods work together to advocate on behalf of the community, organize and plan, then apply for grants to improve workforce development and transportation access for residents.Twenty years ago, Remington, a neighborhood of row houses and old factories, was on the decline. But the community has come together to create a place where people want to live, work, shop and raise families.Remington is both an example of the type of transformative revitalization that can be replicated across Baltimore as well as a reminder that real community change takes time, planning and partnership. Sources:Community Mini-Profile Series 1998 No. 02 (Spring Edition): Remington, prepared by the Community Development Resource Center, Institute for Urban Research, Morgan State University, Spring 1998
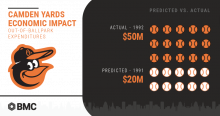
Play ball! The Orioles take on the Minnesota Twins this Thursday, March 29, for Opening Day at Camden Yards. With all the excitement of another professional baseball season, we’ve been a bit curious about Camden Yards’ history, so we dug through the Regional Information Center’s archives.The building of Camden Yards Sports Complex was a hot topic right up until they broke ground in 1988. How much money would a brand new ballpark really bring in? Could it ever replace the much-loved Memorial Stadium? Would it attract new sports talent to Baltimore? New fans? This report from 1996 looked at estimates produced by several Maryland departments including the Department of Fiscal Services, the Office of the Governor, and the Baltimore Development Corporation, and then compared them to the actual financial and political impact post-construction. Estimates predicted a 20 percent increase in attendance from the 1991 final season at Memorial Stadium, creating millions of dollars in direct and indirect benefits to the city. Instead, the 1992 Orioles season smashed expectations with a 76 percent increase. Out-of-town visitors flooded in to eat at local restaurants and stay in downtown hotels, boosting revenues from the new stadium even further. Ultimately, visitors came more often and spent more money in Baltimore City. Camden Yards was built as a baseball-only field in order to keep the Orioles franchise interested. After much debate and negotiation, a football stadium was built as part of the Camden Yards Sports Complex in order to attract a football franchise back to Baltimore. Many of the stadium’s supporters used the results of Camden Yards to show how successful the football stadium could be. The Camden Yards ballpark itself became an example of the potential success of future sports projects. The Ravens played their first two years in Baltimore at the old Memorial Stadium before moving to M&T Bank Stadium for the 1998 season. The Baltimore Sun reported in 2017 that during the 2014 and 2015 seasons, spending associated with games averaged $331.3 million and state tax revenue generated approximately $22.5 million. So however you play it, constructing Camden Yards turned out to be a home run for Baltimore!
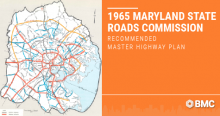
Motorists driving through the Baltimore region may notice several ramps to nowhere along I-95 as they travel into or out of Baltimore City. Once upon a time, these structures were part of a massive regional highway plan.We dug into the archives at the Regional Information Center (RIC) and found the 1965 Maryland State Roads Commission Recommended Master Highway Plan. The document was a grand proposal for I-70 - the major highway that begins in the Baltimore City neighborhood of Franklintown and runs east-west through Maryland to Breezewood, Pa. As put forth more than five decades ago, this highway would have extended to meet I-95 in Baltimore City’s central business district. Problems with traffic congestion and flow already were in full swing in the early 1960s in the Baltimore region. The plan projects growth of more than 2.6 million residents and more than 700,000 vehicles by 1980. This was a tall order for the region’s road network. So as the U.S. Department of Transportation constructed I-95 north and south through central Maryland, the Recommended Master Highway Plan was the solution. The ramps were built, but the I-70 connection never came to fruition. Nor did the construction of the proposed I-83 route through Central and South Baltimore, for that matter. I-70 was scheduled to go straight through the Baltimore City neighborhoods of Fells Point and Canton, while many of the planned higher-occupancy roadways ran through historically low-income and African-American neighborhoods. That’s why community activists, such as Barbara Mikulski, then a fresh graduate of the University of Maryland’s School of Social Work and east Baltimore native, organized city residents from east to west to stop the projects in their tracks. Source: Baltimore Metropolitan Area Transportation Study. Master Highway Plan