American Community Survey - 1216 Med HH Income AACO.pdf
American Community Survey - 1216 Med HH Income AACO.pdf
American Community Survey - Hispanic Population by Census Tract
American Community Survey - Hispanic Population by Census Tract
American Community Survey - Black Population by Census Tract
American Community Survey - Black Population by Census Tract
Asian Population by Census Tract
American Community Survey - Asian Population by Census Tract
Sea Level Rise - Queen Anne's County
Sea Level Rise - Queen Anne's County
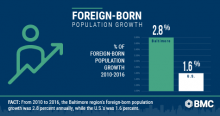
If you’re anything like us, you also found yourself glued to your television, watching the 2018 Winter Olympics in PyeongChang, South Korea. These events are a wonderful way for us to cheer on the United States, watch obscure sports (we’re talking about you, biathlon), and celebrate countries and cultures from around the world. In the opening ceremonies alone, we heard a moving rendition of John Lennon’s “Imagine” and witnessed the enthusiastic return of Tonga’s shiny flag-bearer. In this year’s games we also saw, for the first time, an historic gesture of cooperation in the North and South Korean joint women’s hockey team. The flags, pageantry and intense competition make us proud to be American and remind us of the interconnected nature of our world. So BMC’s data crunchers were a bit curious about the rich cultural fabric of our own backyard – what’s the demographic breakdown of foreign-born residents in the Baltimore region? Foreign-born residents continue to move to the Baltimore region, even 289 years after the city’s founding and 150 years after the first steamships docked in the Locust Point neighborhood to unload passengers. We took a look at the Baltimore region’s foreign born population from 1970 to 2016, which is the most recent data available. In 1970, the total foreign born population in the Baltimore region was 2.8 percent of 2.1 million residents, while Maryland’s was 3.2 percent of 3.7 million residents, and the U.S. had 4.8 percent among 193 million residents. By 2016, Baltimore’s foreign born population shot to 10.4 percent of its 2.8 million residents. Compare that to 15.3 percent of Maryland’s 6 million residents and 13.5 percent of the U.S.’s 323 million residents. While this wasn’t particularly surprising, what we found interesting is that since 1990, the Baltimore region’s foreign-born population is growing at a faster rate than both Maryland and the U.S. From 2010 to 2016, the Baltimore region’s foreign-born growth is 2.8 percent annually, while Maryland’s is 2.5 percent, and the nation as a whole is 1.6 percent. In addition, foreign-born residents are coming to the Baltimore region from vastly different countries in 2016 than they did in 1970. In 1970, 64.7 percent of foreign-born residents in the Baltimore region came from European countries, whereas only 11.1 percent came from Europe by 2010. By comparison, 9.3 percent of the region’s foreign-born residents came from Asian countries in 1970, while 38.7 percent came from Asia in 2010. For more specific information about our region’s foreign-born residents, we then dug into the U.S. Census Bureau’s American Community Survey for 2016. In 2016, 9.7 percent of the Baltimore region’s foreign-born residents were from India, followed by 6.9 percent from Korea, 5.9 percent from China, and 5 percent each from El Salvador and the Philippines. In Maryland, 12.1 percent of the foreign-born population, the highest for the state, came from El Salvador. By contrast, the largest share of the U.S.’s foreign-born population - 26.5 percent - came from Mexico. While we patiently await the 2020 Summer Olympics in Tokyo when we can again don our Team USA gear, remember there is a wealth of cultural diversity to be celebrated right here at home in greater Baltimore each and every day. Sources: IPUMS NHGIS, University of Minnesota, www.nhgis.org; U.S. Census Bureau American Community Survey 2016
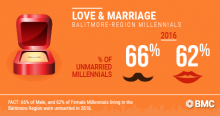
Happy couples will celebrate Valentine’s Day all around the Baltimore region this week. Some will dine at candle-lit restaurants, or buy each other gifts and funny greeting cards. Others might even surprise their beloved with a marriage proposal. Ain’t love a beautiful thing? While it may seem like those married folks are the majority, that’s not the case for Millennials in the Baltimore region. More than 60 percent of Millennials – that’s individuals born between 1977 and 1994 - were unmarried in 2016, according to an analysis of U.S. Census Bureau, Decennial and American Community Survey data. That’s 66 percent of our region’s adult males (222,700 of them) and 62 percent of adult females (218,000), an increase of 15 percent since 1990 for adults ages 22 to 39. Likewise, Millennials in the Baltimore region are getting married later in life, according to the same Census data analysis. The 2016 median age of first marriages for local brides and grooms is 29, while nationally it’s 29.5 for males and 27.4 for females.2 Compare that to 1990, when the median age for first marriages in the U.S. was 26.1 for males and 23.9 for females! Millennials are staying single for longer, and they’re also more educated. Almost half (47 percent) of unmarried females and more than a third (37 percent) of unmarried males have achieved an Associate’s Degree at minimum. If all this chatter about love and romance making you want to settle down, here’s where you should look… Unsurprisingly, Baltimore City has the most single Millennials – more than a third of the region’s unmarried men and women. Baltimore County and Anne Arundel County have 120,500 and 83,400 number of unmarried Millennials, respectively, while Carroll County comes in last with 17,600. We guess we’ll never again wonder why Fell’s Point, Towson and Annapolis are so busy on Friday and Saturday nights.